Join us for an exclusive webinar with Lise


Cryptocurrency Value at Risk (VaR)
Introduction to VaR, available with Kaiko’s Portfolio Risk and Performance solution.
(5 min read) This case study will explore the background, methodology, and use case for Value-at-Risk.
Overview
Risk management is a crucial (and often obligatory) component of the investment lifecycle. One of the most useful risk assessment measures is known as Value at Risk (VaR), which has been used by financial professionals for decades to quantify portfolio risk. In cryptocurrency markets, risk management remains a complex and evolving area of study due to frequent changes in market structure, high volatility, and limited availability of historical data.
VaR is available with Kaiko's Portfolio Risk and Performance solution - one of the first risk management tools designed for cryptocurrencies, leveraging a proprietary and thoroughly backtested methodology that accounts for the idiosyncrasies of crypto market structure. In this article, we will review the background, methodology, and use cases for VaR, showing how cryptocurrency portfolio managers can better manage risk.
What is VaR?
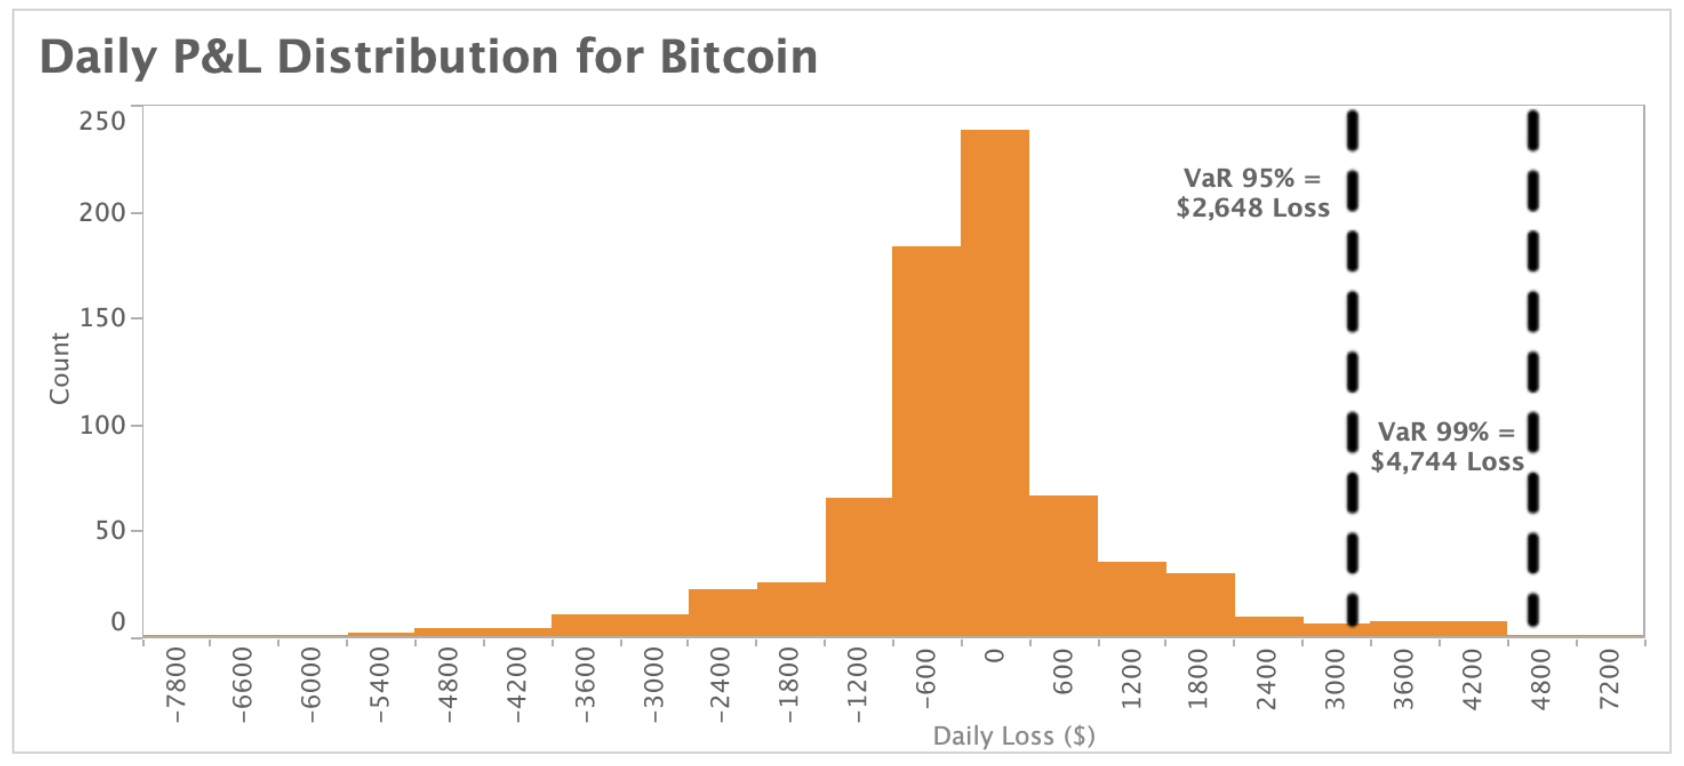
VaR is a risk indicator to quantify the extent and probability of potential losses in a portfolio. It is particularly useful in risk management as it can essentially assign a cash value to a confidence level. These confidence levels usually range from 90% - 99%. For example, if the 95% daily VaR of my portfolio is $100k, it means that:
My portfolio has a 5% chance of losing at least $100k over the next one-day period.
On average I will lose at least $100k one day out of 20 (5 days out of 100).
VaR can be viewed as an acceptable loss, given a confidence level, which makes it a particularly useful metric for compliance purposes as well as capital requirement planning. Since the VaR for different confidence levels exhaustively describes the investment profitability, it can be used for investment management, allowing us to define limit-order levels to crystallize profits or cut losses.
VaR is also well-used in risk-budgeting for optimizing the allocation of assets within a portfolio or for analyzing the impact of a trade on portfolio risk. In practice, this would involve only adding an asset to a portfolio if it keeps losses within the specified VaR parameters.
In traditional financial markets, the most conservative recommendation is to use the VaR at the 99% confidence level and with a 10-day horizon, meaning that on average 1 out of the next 1000 days (1% chance using a 10-day horizon) the next big loss will be reached. These parameters commonly used by banks to ensure high levels of protections for the financial system.
Computation of VaR
There are two categories of methodologies traditionally used to estimate VaR: historical simulation and parametric or semi-parametric methods. As we demonstrate below, VaR can be calculated by plotting the past distribution of returns for an asset or portfolio over time (using the historical simulation method).
This method for calculating VaR works well for traditional financial markets that have robust historical data and infrequent shifts in market structure. However, issues arise in markets when the past data is not reflective of current market conditions, or when there is just not much data available to use in the VaR computation.
As a relatively new asset class, cryptocurrencies have both of these issues: there is not only a limited history of data to use, but the data that is available displays large amounts of non-stationarity, meaning market conditions change very frequently over time.
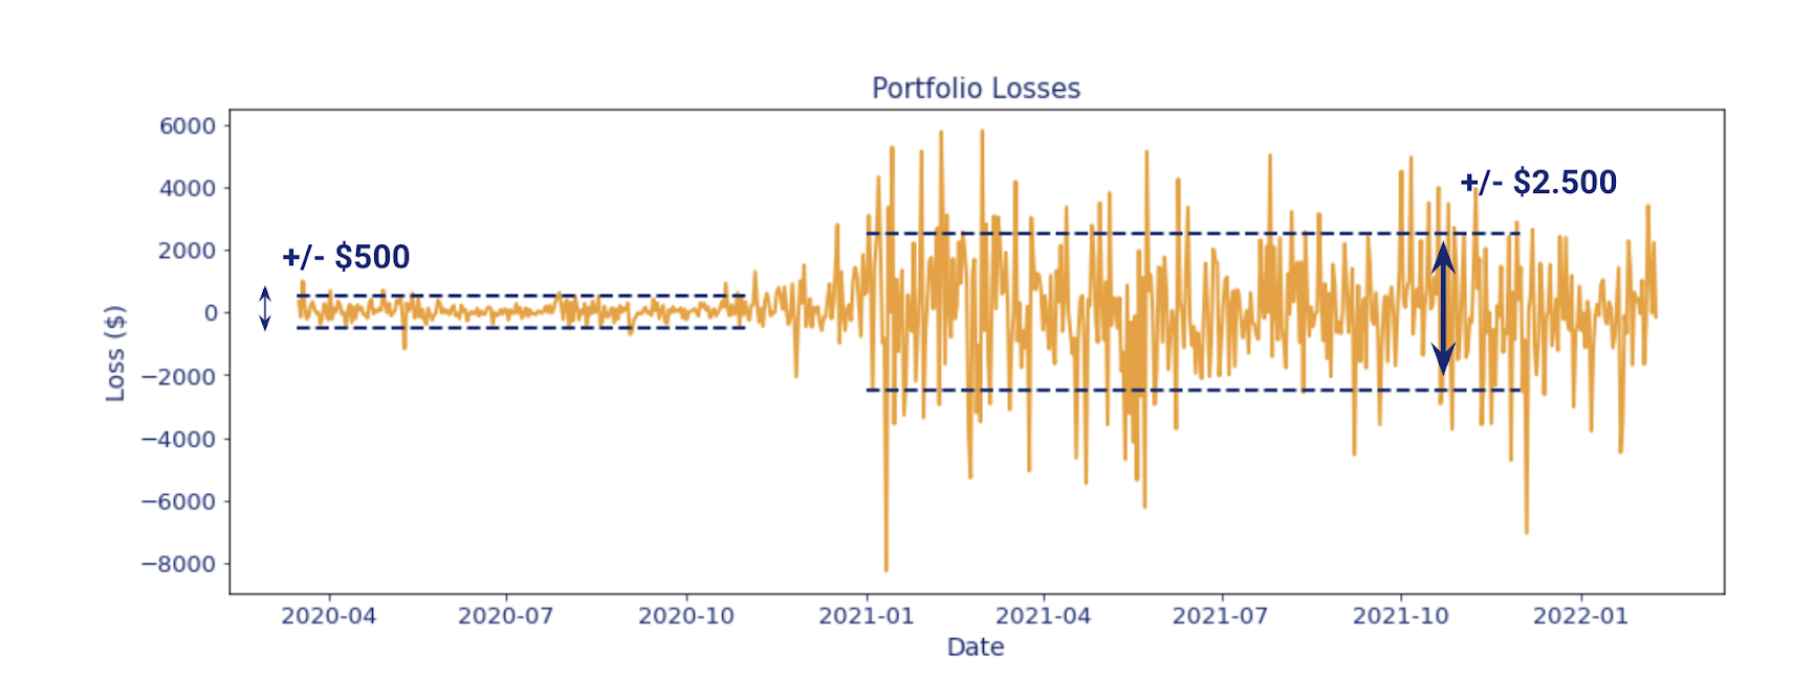
This non-stationarity can be seen below, where we have plotted a sample portfolio’s return volatility in 2020 versus 2021. Market conditions in 2020 resulted in an average variance in returns of $500, compared to 2021 which produced an average variance of $2,500.
VaR Methodology
Kaiko’s analytics team developed a new methodology to calculate Value at Risk for crypto portfolios, taking into account the idiosyncrasies of crypto market structure. The Kaiko methodology can be classified in the historical simulation category of methodologies but differs from the standard method by applying:
a daily loss normalization procedure
an adaptive weighting strategy to take into account the most relevant information
Using the above chart as an example, the VaR for this portfolio would be higher using Kaiko’s methodology due to the fact a heavier weight is placed on the more volatile returns. This is a more accurate representation of the heightened risk to a crypto portfolio in 2021. The traditional method of computing VaR is insufficient because it would apply an equal weight to the 2020 returns and thus understate portfolio risk, due to the fact that 2021's market conditions were far more volatile than the previous year’s.
Case Studies
Monitoring Daily VaR
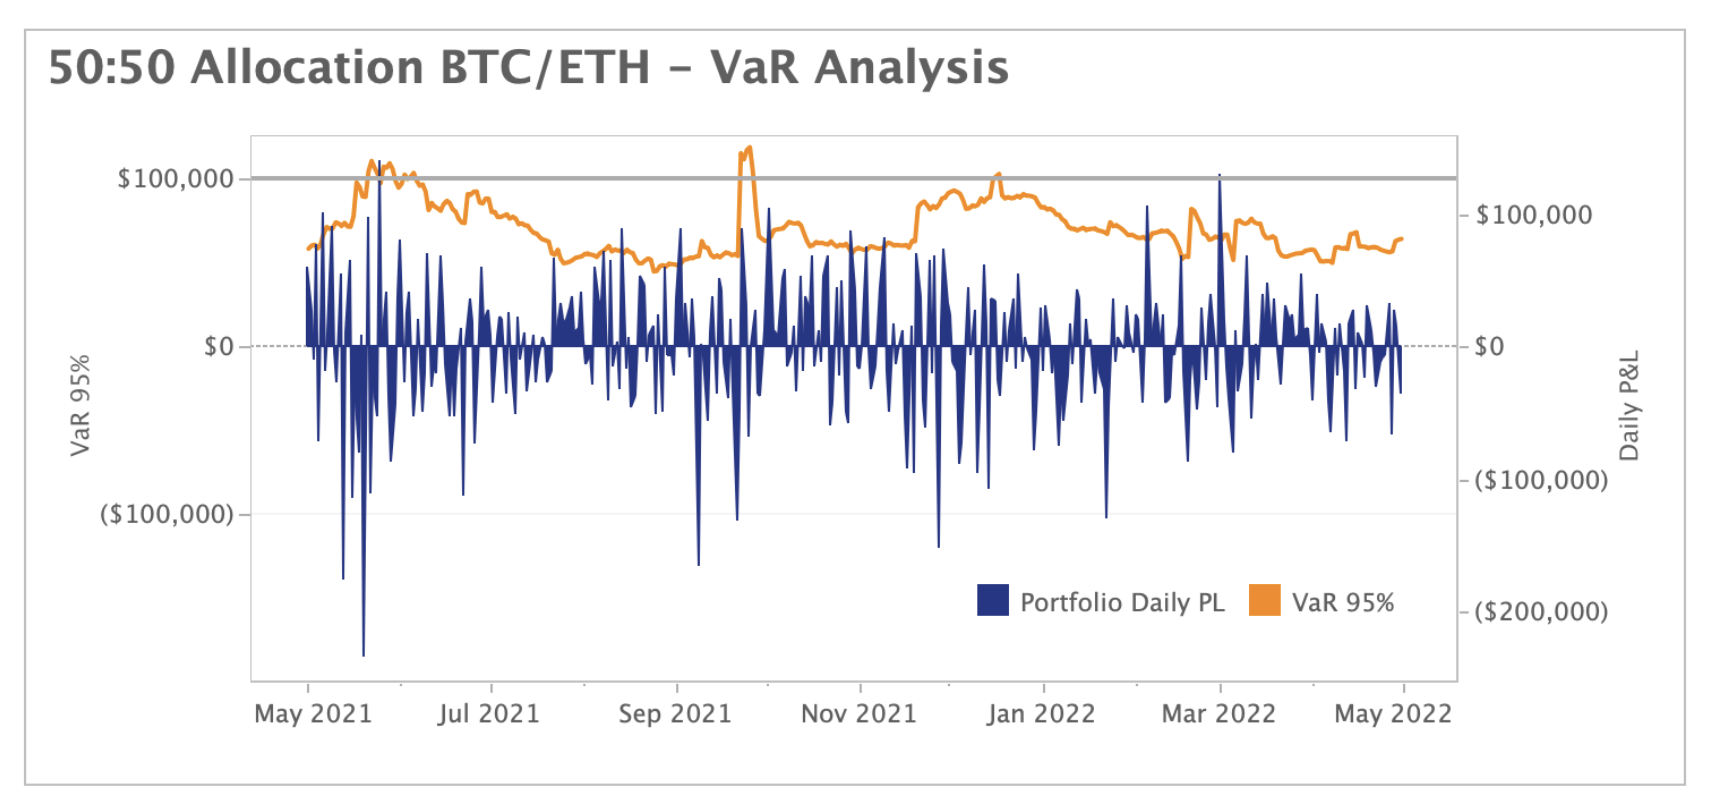
The VaR data can be applied to any cryptocurrency portfolio to accurately track VaR over time. Below, we have charted the Daily P&L and Daily VaR of an equally weighted $1 million portfolio of Bitcoin and Ethereum. Suppose I’m setting my risk budget for my portfolio, and don’t want to lose more than $100k one in every 20 days on average. I would set my VaR risk level to 95%, charted below, and monitor when my portfolio exceeds that $100k level. When the portfolio VaR exceeds that level I would look to de-risk my portfolio so that my Value-at-Risk is under that $100k threshold.
$500k Addition to a $1m BTC/ETH portfolio
Another interesting use of VaR in allocation decisions is factoring in your potential portfolio risk when adding an allocation to a new asset. Let’s take the same portfolio as the previous example, $1m total value, equally weighted between BTC/ETH, except now we’re looking to add an extra $500k to the portfolio in the form of a new asset. The new allocation will be split in equal thirds, but we want to limit our average biggest loss every 20 days to $75,000, so we set our VaR risk level at 95%. The below chart tests five potential asset additions to our BTC/ETH portfolio to see which crosses the hypothetical $75k loss threshold.
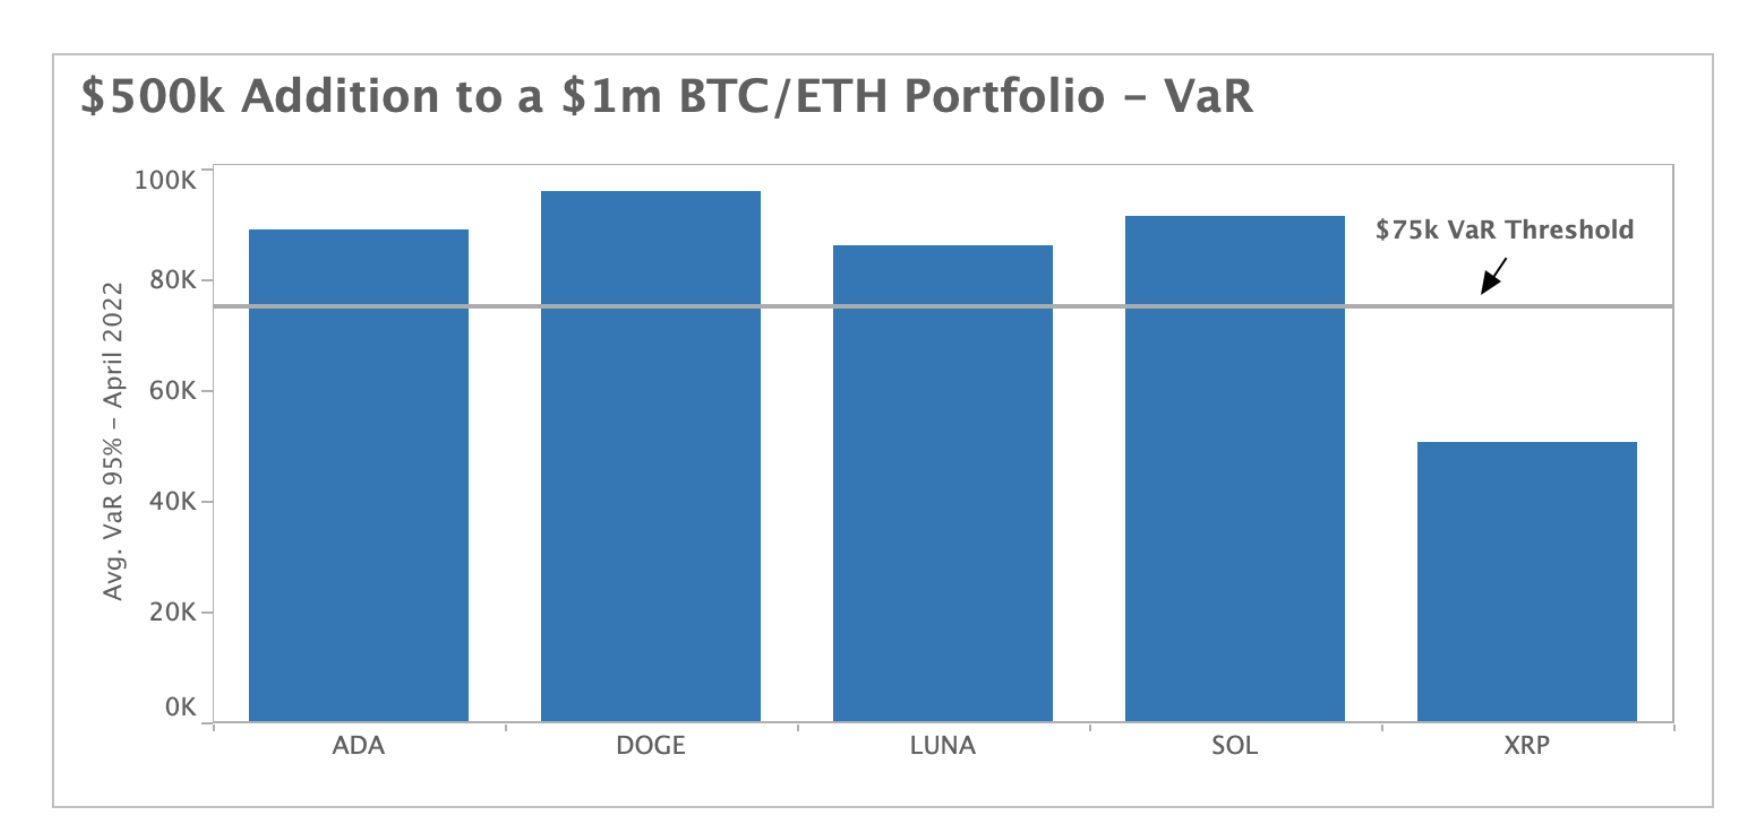
Using Kaiko’s VaR methodology for crypto assets, we have charted above the new, average portfolio VaR for the month of April after adding $500k of each asset listed. Interestingly, we observed that XRP was the only asset that resulted in the new portfolio satisfying our hypothetical VaR threshold of $75,000.
How to Use OUR Portfolio Risk and Performance SOLUTION
Portfolio Risk and Performance enables our clients to test different cryptocurrency portfolio allocations for a range of confidence levels. The service is available through our REST API or as custom CSV file exports.
As inputs, you can specify any time interval, assets and corresponding asset amounts, and the service returns both VaR and P&L for the allocation. For example, if you want to test a BTC/ETH $1 million portfolio allocation for the previous 1 year, you would input the following information:
Conclusion
Risk management is a crucial component to any portfolio allocation strategy in both traditional and cryptocurrency markets. Portfolio Risk and Performance enables more accurate estimates of crypto portfolio risk, accounting for the idiosyncrasies of cryptocurrency market structure. To get started on a trial, contact us today.