Kaiko Acquires Amberdata in Landmark Digital Asset Data Consolidation.


- Home
- Kaiko Indices
Index In Focus
Index in Focus
Insights and analysis on trends in crypto index investing.
Kaiko Index in Focus
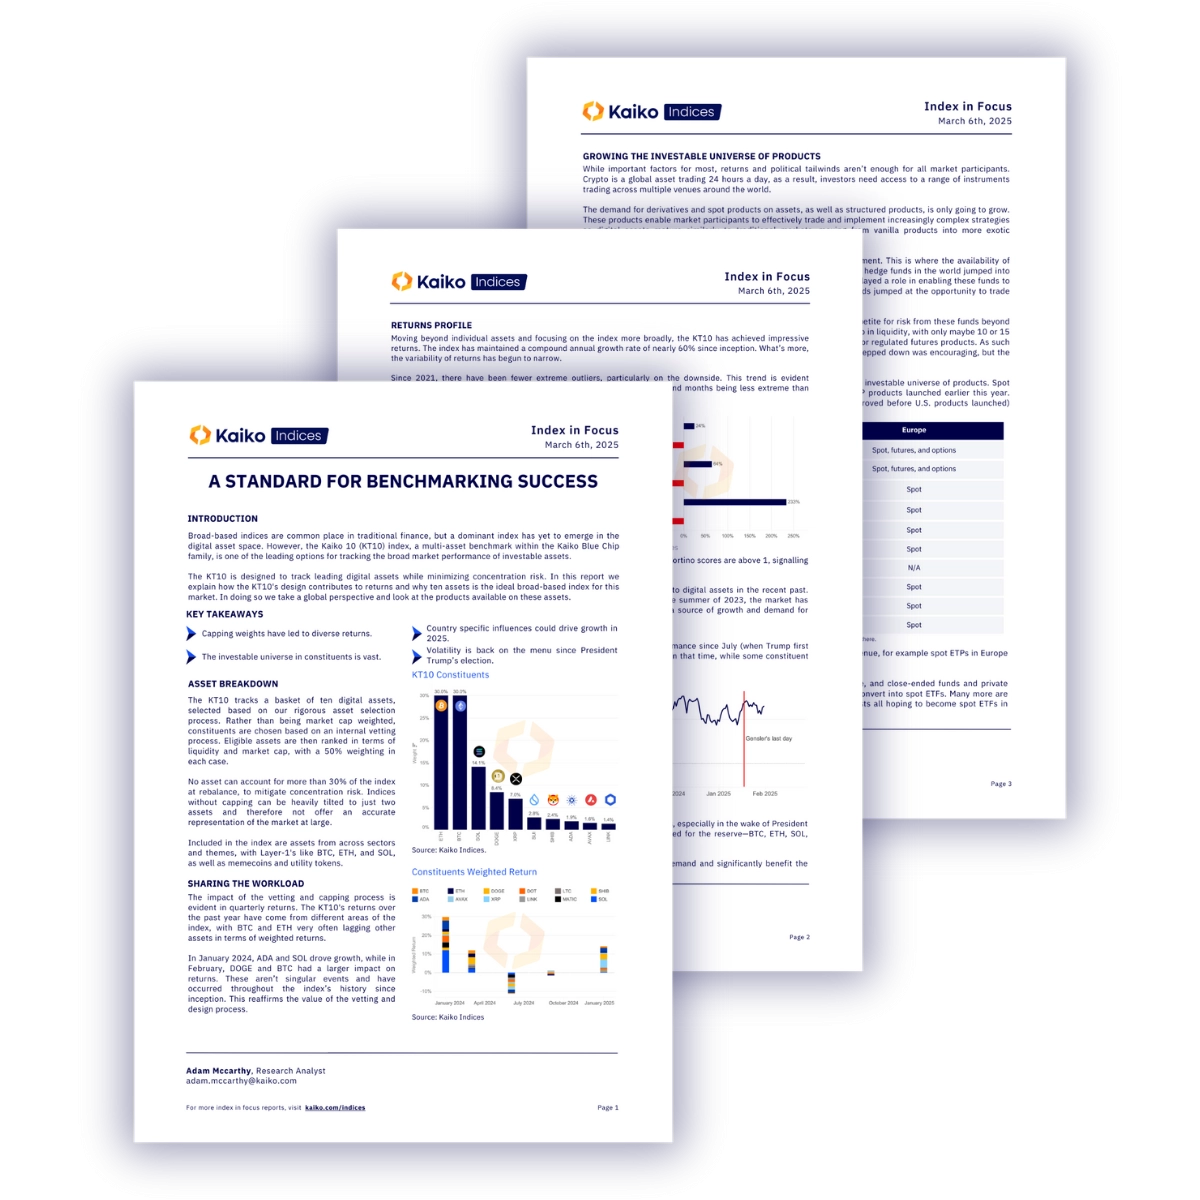
Kaiko Indices’ Index in Focus delivers weekly in-depth analysis of key index products, including on their composition, performance, and investment thesis. Special editions dive deeper, covering quarterly rebalancing and sector-wide trends to keep investors ahead in a shifting market.
Index in Focus is included in the free tier of the Kaiko Research App.
-
Kaiko Indices launches
-
Market moving events
-
Quarterly rebalancing of our flagship KT10 index
-
Sector and Thematic overviews