S&P Global Leads Strategic Investment in Kaiko, Extending Series B to $110 Million



How $3.21B Vanished in 60 Seconds: October 2025 Crypto Crash Explained
28/07/2025
This blog was originally published by Amberdata prior to Kaiko’s acquisition and may not completely reflect Kaiko’s position on topics or matters involved. You can learn more about Kaiko’s purchase of Amberdata, here.
On October 10, 2025, at exactly 21:15 UTC, $3.21 billion in cryptocurrency positions evaporated in a single minute.
By the time the cascade ended 14 hours later, $9.89 billion in leveraged positions had been forcibly liquidated – one of the largest deleveraging events in crypto history. But the real story isn’t the total destruction. It’s the concentration: 70% of the damage happened in just 40 minutes, at a rate 14.6x faster than the hours before and after. This analysis breaks down how and why one of crypto’s fastest collapses unfolded.
This is the anatomy of a modern market collapse – where leverage meets liquidity failure at algorithmic speed.
The Puzzle: Why Did 70% Happen in 40 Minutes?
The timeline reveals four distinct triggers throughout the day:
- 14:27 UTC – Large whale short positions established
- 14:57 UTC – Trump tariff announcement hits markets
- 15:32 UTC – WLFI token selloff spreads contagion
- 20:50 UTC – The cascade begins
Here’s what doesn’t make sense: if the macro catalyst hit at 14:57, why did the real destruction wait over five hours? And why, after hours of gradual decline, did the market suddenly accelerate into a 40-minute liquidation frenzy that destroyed $6.93 billion?
The answer isn’t in the price charts. It’s in what was happening beneath the surface across seven dimensions of market microstructure – price action, liquidations, open interest, funding rates, order book depth, bid-ask imbalance, and spread widening. Each dimension tells part of the story. Together, they reveal exactly how modern markets fail.
The Surface: What everyone saw
Bitcoin declined 6.84% from $121,576 to $113,263 – painful, but relatively controlled. The real carnage was in altcoins:
- UNI: -26.92% with a 70.10% intraday drawdown
- AAVE: -69.48% maximum drawdown
- AVAX: -69.20% maximum drawdown
- DOGE: -64.72% maximum drawdown
While Bitcoin fell 7%, altcoins collapsed 20-27%. The divergence tells the first part of the story: when forced liquidations hit thin order books, price impact amplifies exponentially.
Volatility metrics captured the moment of transition. Bitcoin’s 5-minute rolling volatility averaged 0.14% across the day but spiked to 2.82% at 21:22 UTC—a 20x increase. WLFI exploded from 0.64% to 16.24%—a 25x spike. These weren’t normal price movements. These were mechanical liquidations overwhelming price discovery.
The Cascade: $6.93B in 40 Minutes
The liquidation data exposes the mechanical precision of the cascade:
- Before (13:00-20:50): $0.92B liquidated over 8 hours = $0.12B/hour
- During (20:50-21:30): $6.93B liquidated in 40 minutes = $10.39B/hour
- After (21:30-03:00): $2.05B liquidated over 5.5 hours = $0.37B/hour
That’s an 86x acceleration from the pre-cascade rate. And the composition reveals the mechanism:
Total liquidations: $9.89B
Long liquidations (forced selling): $8.30B (83.9%)
Short liquidations (forced buying): $1.60B (16.1%)
Long/short ratio: 5.2:1
This wasn’t balanced volatility – it was one-directional pressure. Overleveraged longs were systematically wiped out as prices fell through liquidation thresholds, creating more forced selling, which pushed prices lower, which triggered more liquidations.
At the peak minute (21:15 UTC), $3.21 billion disappeared in 60 seconds with 93.5% being forced selling. Zero time for human intervention. This was pure algorithmic execution.
The Infrastructure Collapse: When Liquidity Disappeared
While traders watched prices fall, the market’s underlying infrastructure was failing catastrophically. Three critical liquidity dimensions collapsed simultaneously:
Open Interest: The Leverage Unwind
Open interest – the total value of all open leveraged positions – collapsed $36.71 billion (-25.03%) from peak to trough. During the 40-minute cascade alone, $19.20B evaporated – 52% of the total deleveraging compressed into those critical minutes.
This wasn’t just falling prices. This was the systematic unwinding of $146.67 billion in leveraged positions, with half the damage concentrated into a 40-minute window.
Order Book Depth: The 98% Evaporation
Markets that showed $103.64 million in visible liquidity suddenly had just $0.17 million available – a 98%+ collapse. The bid-ask imbalance flipped from +0.0566 (bid-heavy, buyers waiting) to -0.2196 (ask-heavy, sellers overwhelming the market at a 78:22 ratio).
The liquidity that was supposed to be there when you needed it? It vanished the moment you needed it most.
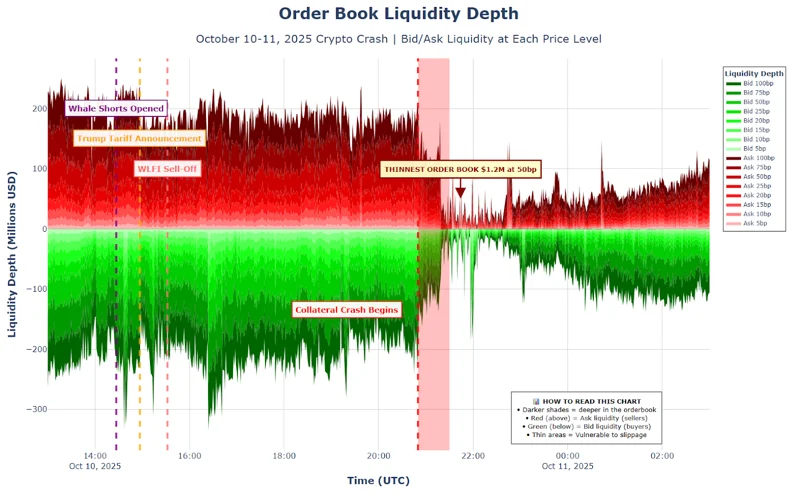
Bid-Ask Spreads: The 1,321x Explosion
Bitcoin perpetual swaps started the day as the tightest-spread instruments in crypto: 0.02 basis points – sub-penny spreads on a $121,000 asset. At 21:31 UTC, spreads hit 26.43 basis points – a 1,321x widening.
To put this in practical terms: a $10 million liquidation at peak spread would cost $26,000 in spread costs alone, before accounting for slippage or market impact. And this happened precisely when forced liquidations had no choice but to execute.
During the 40-minute cascade, spreads averaged 5.92 bps – 30x wider than the 0.20 bps pre-cascade average. Exchange fragmentation was extreme: Binance maintained 2.50 bps during the cascade while Arkham hit 13.14 bps – over 5x worse.
This is systemic failure: all three liquidity dimensions collapsing simultaneously, each amplifying the others in a deadly feedback loop.
The Synthesis: Macro Fuse, Leverage Bomb
Two competing theories emerged to explain October 10:
Theory 1 (Macro-Driven): Trump tariff news and WLFI selloff triggered risk-off sentiment across all assets.
Problem: Macro news doesn’t explain 6-hour delays or 40-minute concentration windows.
Theory 2 (Leverage-Driven): Pure mechanical cascade driven by overleveraged positions.
Problem: Doesn’t explain the initial 14:27-15:32 triggers.
The data proves both – in sequence.
Stage 1 (14:27-20:50): Macro catalysts created gradual selling pressure over six hours, slowly pushing prices toward liquidation thresholds. Meanwhile, $146.67 billion in open interest sat intact—a powder keg waiting to explode.
Stage 2 (20:50-21:30): The collateral crash triggered mechanical cascade. Each liquidation created forced selling. Forced selling pushed prices lower. Lower prices triggered more liquidations. Simultaneously, spreads widened 1,321x, depth evaporated 98%, and the order book flipped from bid-heavy to ask-heavy.
The 14.6x rate acceleration and 70% damage concentration prove this wasn’t discretionary trading – it was algorithmic execution destroying infrastructure faster than humans could react.
The verdict: Macro catalysts lit the fuse. Leverage was the bomb. The 40-minute cascade was forced deleveraging at machine speed.
Five Lessons from $9.89 Billion
- Leverage Creates Systemic Fragility
$146.67B in open interest became a powder keg. At 50-100x leverage, modest price moves trigger catastrophic cascades. - Liquidity is Conditional
Markets appearing liquid with 0.02 bps spreads and $103M depth became illiquid when needed most. Visible liquidity ≠ accessible liquidity during stress. - Cascades Are Mechanical and Fast
$3.21B liquidated in 60 seconds. Zero time for human decision-making. - Markets Are Fragmented
Liquidity resilience varies 5-16x across exchanges. Venue selection matters during stress. - Feedback Loops Amplify
Each liquidation consumed liquidity, widened spreads, and triggered more liquidations—turning a $0.71B/hour baseline into $10.39B/hour destruction.
What October 10 Proved
The cascade exposed crypto derivatives’ core contradiction: nanosecond execution speed with frontier-era risk management. Sophisticated microstructure without circuit breakers. Deep leverage without systemic monitoring.
Three truths are now undeniable: leverage kills at scale, liquidity disappears when needed, and cascades accelerate exponentially.
The next catalyst is inevitable. Whether the market learns these lessons or repeats them at larger scale – likely with much more than $147B behind it – remains to be seen.
For more in-depth analysis, sign up to Kaiko’s free crypto research. Access the critical insider information you need to understand crypto market movements, the logic behind them, and the trends that will define what’s to come.
More data blogs from kaiko
![]() REPORT: The Verticalization Thesis: How Blockchain Revenue Models Are Evolving
16/07/2026
Data BlogThis report provides an overview of the evolving business model of blockchain networks. We analyze incumbents and newcomers, showing how each of them leverages verticalization differently to answer a simple question: How is the business model of blockchain networks evolving?
![]() REPORT: Crypto Exchanges are Building Financial Super Apps for the Next Billion Users
15/07/2026
Data BlogThis report examines how leading crypto exchanges are evolving from trading venues into integrated financial platforms spanning trading, yield, payments, custody, and collateral. Using a four-layer framework, it explores how liquidity, retained balances, onchain payments, and institutional collateral rails are reshaping exchange competition.
![]() REPORT: Measuring Risk in Crypto Options
11/06/2026
Data BlogIn this report, Kaiko and MerQube analyze how crypto-native and ETF Bitcoin options priced risk differently across two parallel markets in 2025.